The peripherals registers view
Contents |
After the success of the J-Link plug-in, which significantly reduced the configuration effort to start a debug session, the most requested feature was a way of examining/modifying the peripheral registers.
There were other solutions already available for this, but all required the availability of various hardware definitions files, plus the manual selection of the appropriate file for the current debug configuration.
The GNU MCU Eclipse plug-in approach is a more integrated one, based on CMSIS Packs. In fact the main reason for introducing the peripheral registers view only now was the need for the CMSIS Packs technology to mature and of course a CMSIS Packs Manager implementation.
Prerequisites
The Packs plug-ins
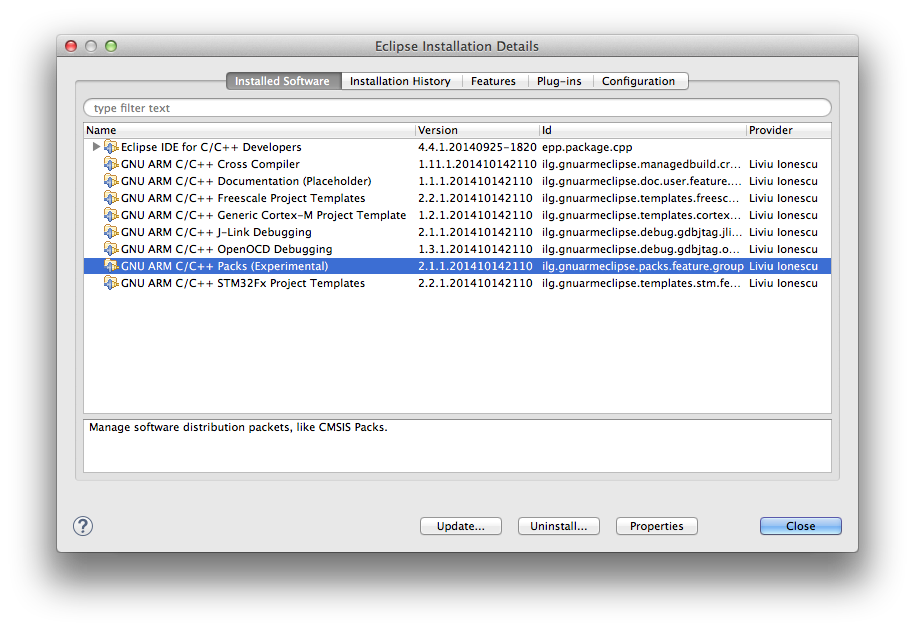
The first thing required is the presence of the Packs plug-ins. To check if they are installed, use the About Eclipse menu and click the Installation Details button.
If not present, it is recommended to first read the Packs manager documentation page where installation details are also provided.
Install required packs
Once the Packs plug-ins are available, and the list of available packages was retrieved, it is necessary to install the packages related to the devices used by the projects under development.
Please note that failure to do so will prevent the device selection window to make the desired device available for selection.
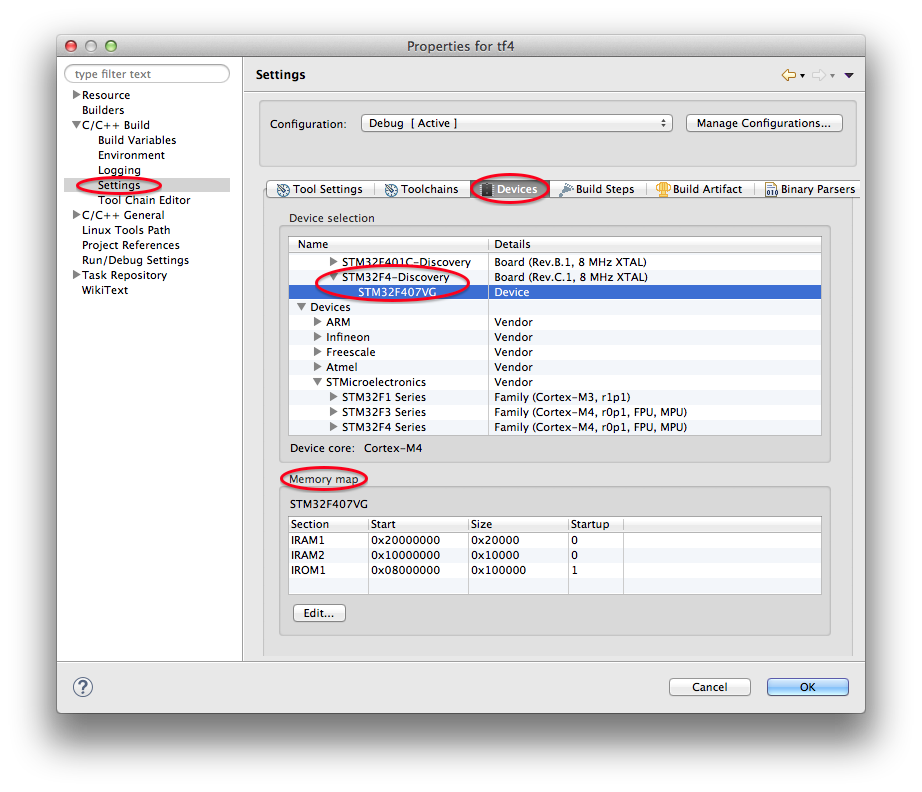
Associate a device to the project
Even if a future release will automatically make this association via a wizard during project creation, it is still recommended to check it, and adjust if needed.
For more details, please visit the separate page.
The debug configuration
With the device associated to the build configuration, the debug configuration is created and started the usual way:
- select the .elf file
- right click, Debug As → Debug Configurations…
- double click the GDB SEGGER J-Link Debugging (or OpenOCD, or QEMU)
Device name automatic configuration
Since the device name is (should be) known, the J-Link Device name field is automatically configured with the CMSIS device name.
The Peripherals view
After starting the debug session, the typical Debug perspective is shown.
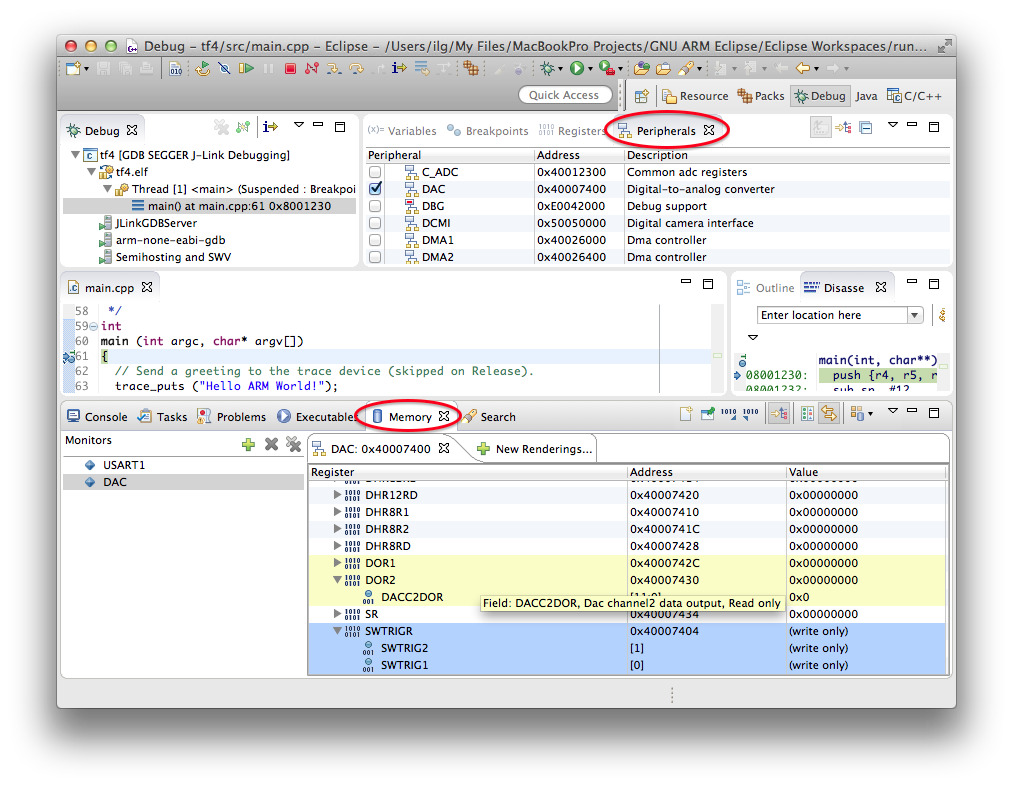
New to this perspective is the Peripherals view, added to the right of the Registers view, in the same window with Variables and Breakpoints. If, for any reasons, this view is not shown, although the Packs plug-ins were installed, try to perform a Reset on the Debug perspective.
The Peripherals view lists all peripherals available in the device hardware description .SVD file provided by the silicon vendor.
The list includes the peripheral name, the peripheral memory address, a short description and a check box that can be used to select the peripherals to be monitored in the debug session.
Maximal peripherals list
Some silicon vendors, like ST, provide a single .SVD file for an entire family of devices. Although this avoids a lot of redundancy, with the current .SVD specifications it is not possible to filter out the devices not used by some family members, so in such cases expect to encounter peripherals that actually are not available in some devices.
System registers
The current SVD specifications do not cover very well if/how the vendor should define the system registers, like SysTick, NVIC, Debug, etc, so it is up to the silicon vendors how to do it; some define the system registers grouped in one single custom peripheral, some in multiple peripherals, and some do not even define all system registers.
The Memory monitors
Since for most modern devices the peripherals are memory mapped devices, in the GNU MCU Eclipse implementation, selecting a peripheral in the Peripherals view does not open a separate window, but a standard Memory monitor, mapped to the corresponding peripheral memory area.
The peripheral monitors are listed in the same view with usual memory monitors, and preserve all common behaviour, like individual Remove or Remove All.
The difference comes in the custom rendering, represented as a tree in the right side of the window.
According to the SVD specifications, this tree can have the following nodes:
- clusters of registers,
- arrays of clusters,
- registers
- arrays of registers
- bit fields.
All of them are currently supported and depicted in a hierarchical way.
Special access registers
According to SVD, registers or fields can have special access rights, like read-only (highlighted in light yellow) or write-only (highlighted in light blue).
Tool tips
By hovering the mouse over the peripheral monitor window, additional details are shown as tool tips. Different content is shown for different columns, for example the Register column will show detailed descriptions, the Address column will show offset and size, and the Value column will show reset value and mask.
Editing
The values of the non read-only registers can be changed using in-place-editing, in the corresponding cell of the Value column.
Registers and fields are synchronised, editing the value of a field will also change the value of the parent register, and editing the value of a register will also change the affected fields.
Filtering
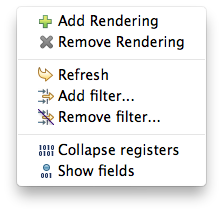
It is possible to filter the content of the peripheral monitor by register name. To enter the filtering conditions, right click anywhere in the monitor rendering window and select the Add Filter… action.
Note: In the initial release the functionality behind this menu needs more polishing…
Troubleshooting
Zero values?
The first question some people might raise is “why so many peripherals have zero values?”. Well, most probably because they are not enabled, so reading them leads usually to zeroes. Or because they do not exist for the actual device, and are present there because the silicon vendor provides a single file for the entire family.
“No devices available, install packs first”
If your devices window is empty, you did not read carefully the above steps. You need to update the list of available packages, then install the ones you need.
Support
In case you encounter bugs or problems, the usual SourceForge support trackers are available.
If you have problems with the actual registers/fields definitions, well, there isn’t much that we can do to fix them, but we still can forward your complains to ARM/Keil, to further forward them to the silicon vendors.
Credits
The use of a memory monitor to view peripheral registers, and the look and feel of the interface was inspired by the (now defunct) Red Suite 5 by Code Red (acquired by NXP). Many thanks for providing the inspiration!
