The QEMU debugging Eclipse plug-in
Contents |
Quicklinks
If you already know what are the features of the new plug-in and only want to know how to install/use it, you can directly skip to:
Why a new plug-in?
The short answer is: because a debugging plug-in provides the best integration of the emulator into the Eclipse debugger, making debugging in an emulated environment more convenient than on physical boards.
Prerequisites
Before being able to use QEMU with the GNU MCU Eclipse plug-ins, you must separately install:
- the QEMU debugging plug-in
- the GDB debugger (client) application, as part of a GNU toolchain
- the xPack QEMU Arm.
If you did not do it yet, please follow the instructions in the QEMU install page and return when completed.
The presence of a GDB as part of a GNU toolchain is mandatory, and it is recommended that the version of the GDB client matches the toolchain. Generally only debugging .elf applications is possible, and these applications must be compiled to include GNU compatible debugging information (like dwarf).
QEMU plug-in usage
Define the QEMU folder location
Before starting work with QEMU, it is required to define the path to the QEMU folder.
-
in the Eclipse menu, go to (Window →) Preferences → MCU → Global QEMU Path (or Workspace QEMU Path)
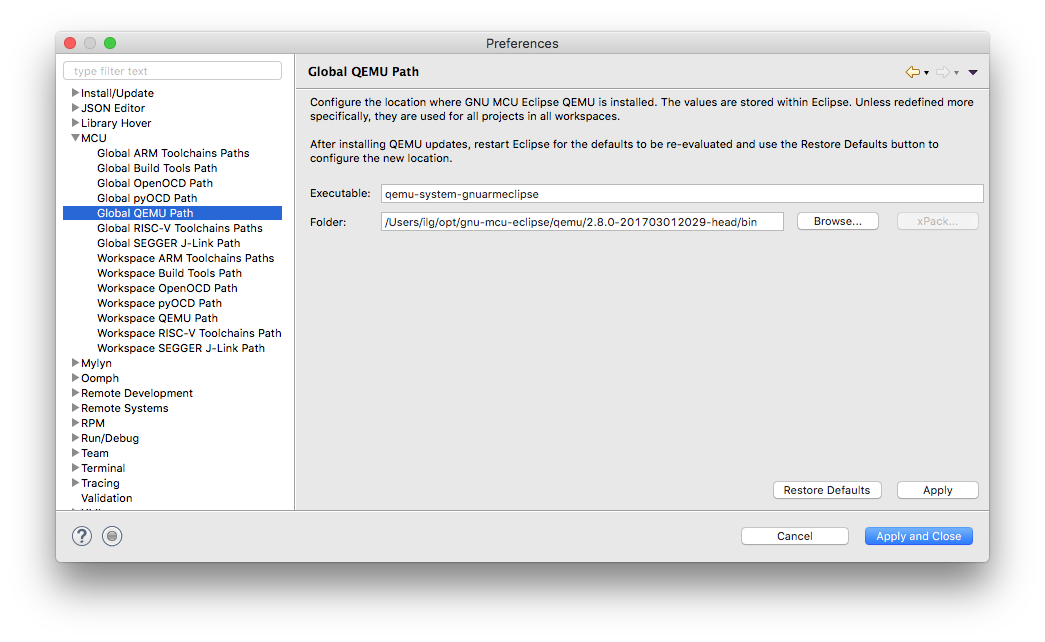
- click the Restore Defaults button
- the plug-in will suggest the default values computed when Eclipse started; if a new version of GNU MCU Eclipse QEMU was installed while Eclipse was active, restart Eclipse and click again the Restore Defaults button
- check the Executable: field; it must define the name of the QEMU executable; in most cases it should be already set correctly; if not, edit it to match the correct name;
- check the Folder: field; it must point to the actual folder where the xPack QEMU Arm was installed on your system, for example
/Users/ilg/opt/xPacks/qemu-arm/<version>/binon macOS - click the OK button
By default, the GDB server is defined as ${qemu_path}/${qemu_executable}; these two macros are automatically set by the above preference page; for portability reasons, it is recommended to keep this definition in all your debug configurations, and also to have a single place to update the path when a new version of the xPack QEMU Arm is released.
Associate a device to the project
Although not absolutely mandatory, it is recommended to associate a device to the project, so that creating the debugger launch configuration will automatically fill-in the device name.
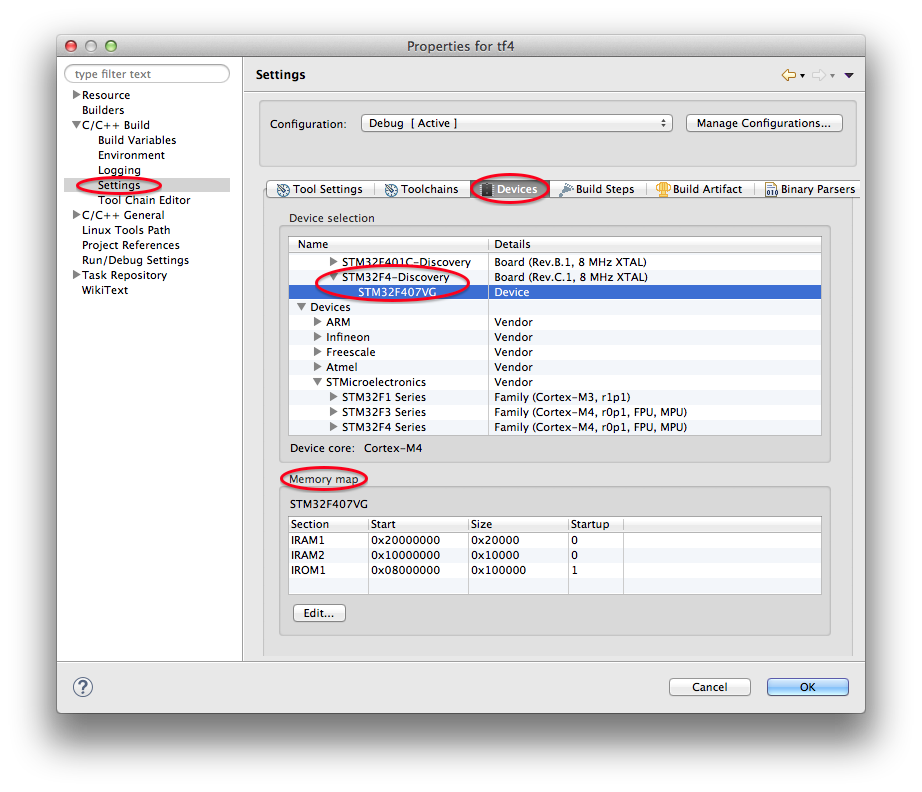
Follow the steps in the separate page Associate a device to the project and return to this page to continue.
Create the debugger launch configuration
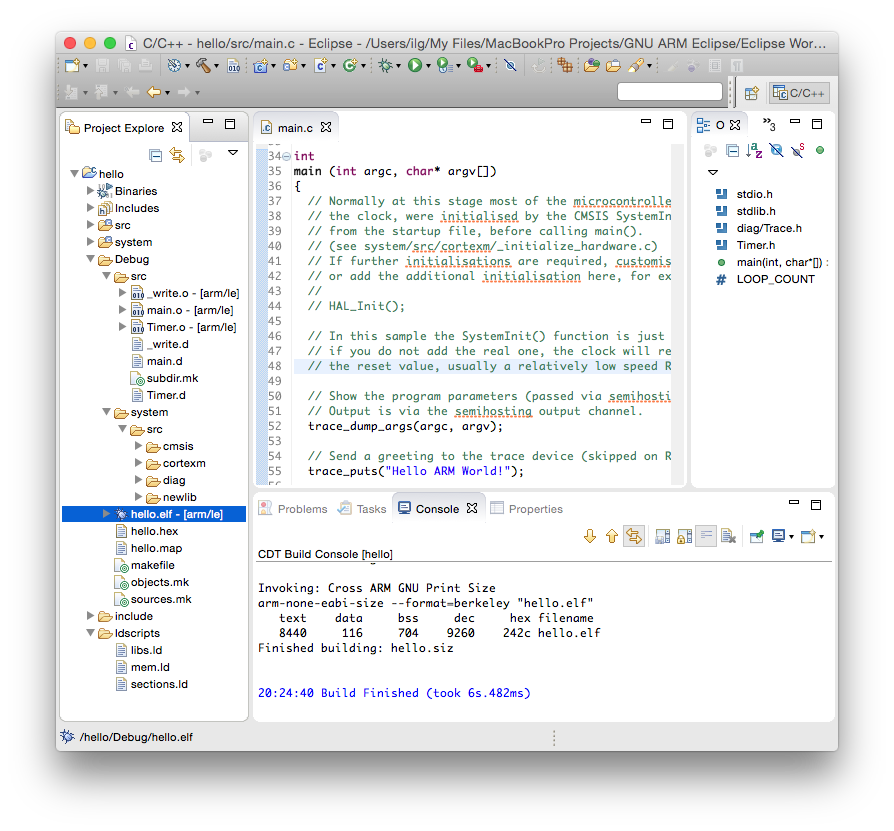
Being a standard debugger, this plug-in also uses the Eclipse standard method of creating debugger configurations for each application. After you successfully build your application, you can create a new debug configuration following these steps:
- select the project
- build it and ensure the executable file is available
- expand either the Debug or the Release folder and select the executable you want to debug
-
in the Eclipse menu, go to Run → Debug Configurations… or select the down arrow at the right of the bug icon.
-
double click the GDB QEMU Debugging group, or select it and click the top leftmost New button.
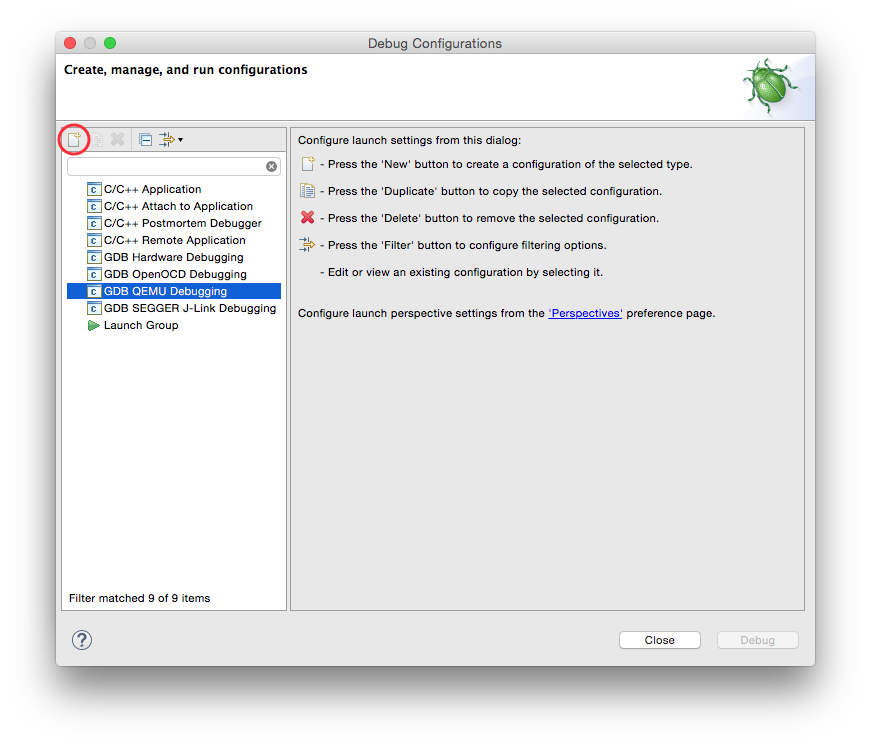
- a multi-tab page will be displayed;
-
if you started this procedure with the project selected and the project was previously built, the first tab, named Main, should be already filled in with the project name (for example hello) and the application file name and location (for example
Debug/hello.elf).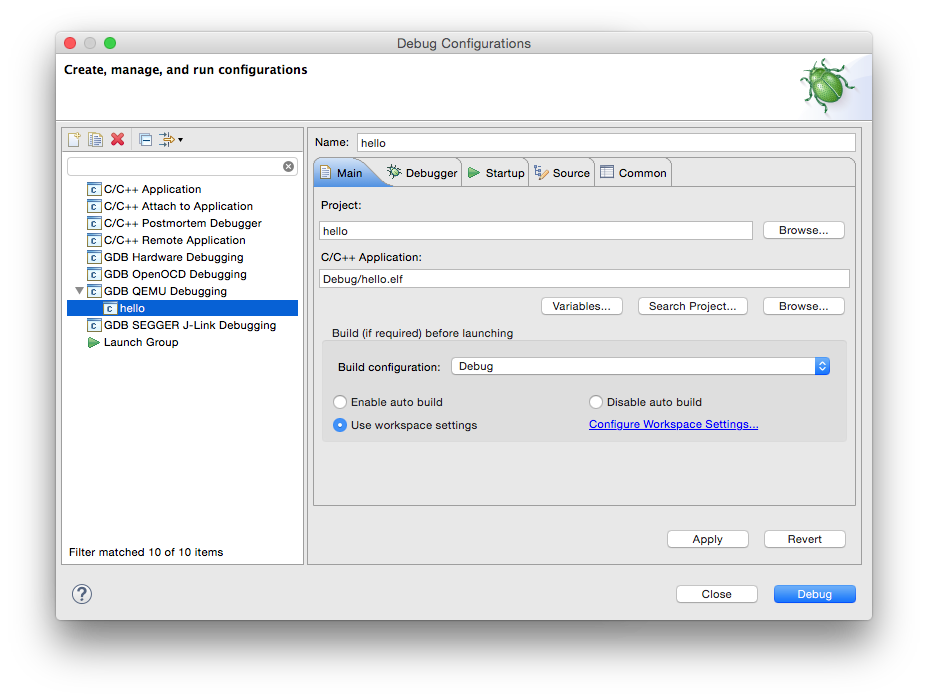
-
click the second tab, named Debugger, which contains the configuration options required to start QEMU as a GDB server and the GDB client.
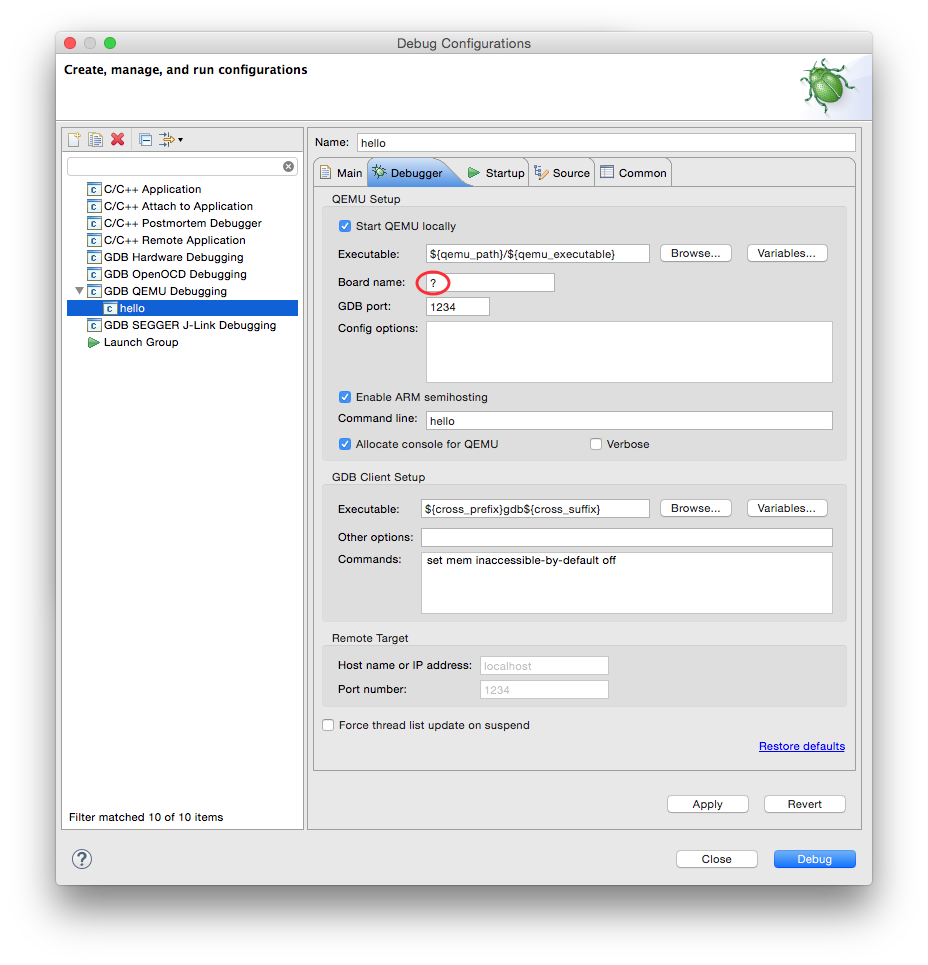
- at your first run it is recommended to leave the Board name: field as it is, with a question mark, for the emulator to display the list of supported boards.
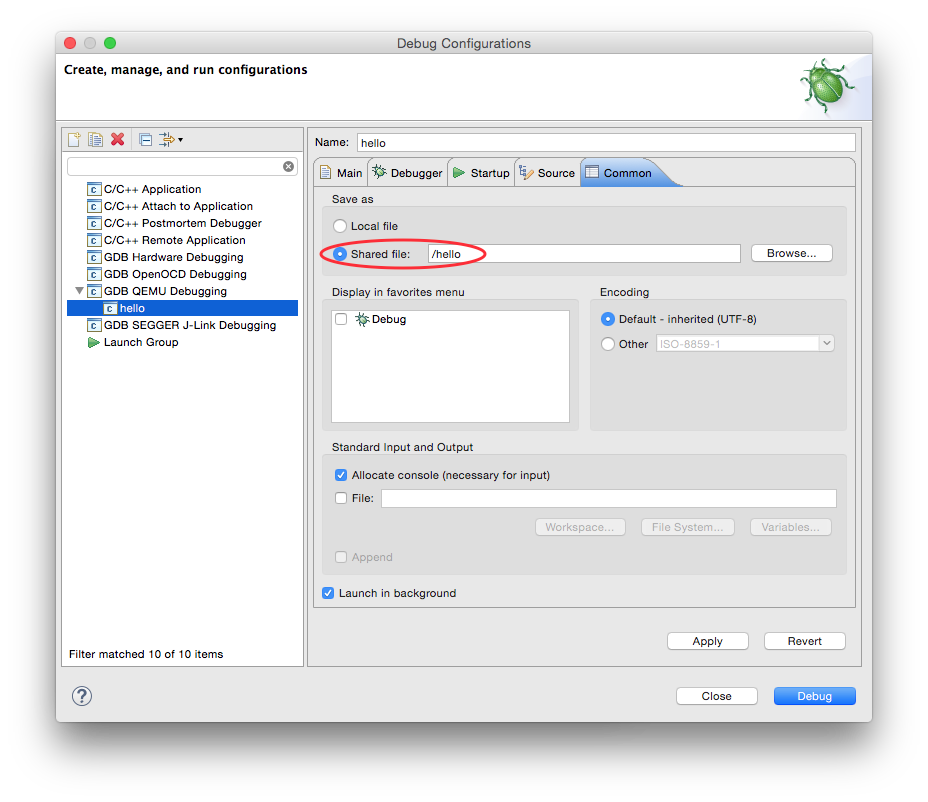
- although not mandatory, it is recommended to change the location where the launcher file is stored; for this,
- select the Common tab,
- set the Save as: field to Shared file
- accept the current project name.
- click the Apply button
- click the Close button.
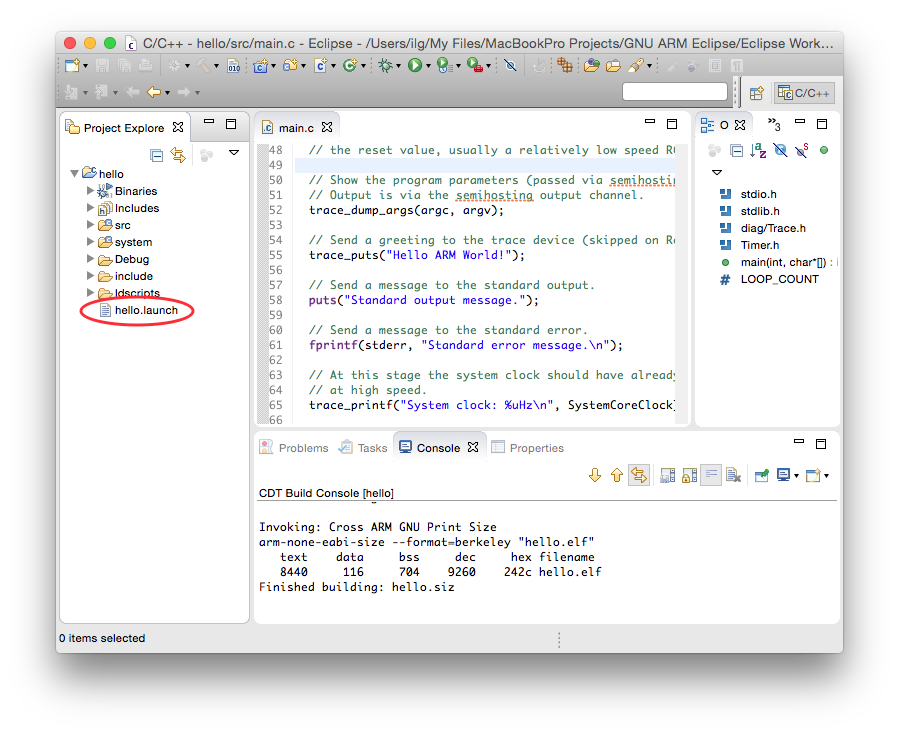
With the above settings, the debug configuration will be saved in the project, not in the workspace storage.
Start a debug session
With all the above steps completed properly, you can start the debug session:
- in the Eclipse menu, go to Run → Debug Configurations…
- if necessary, expand the GDB QEMU Debugging group
- select the newly defined hello configuration
- click the bottom Debug button
Alternatively, on subsequent runs, you can use the bug specific icon. By default this will start the previously used debug launch configuration; to start a different configuration, use the down arrow button:
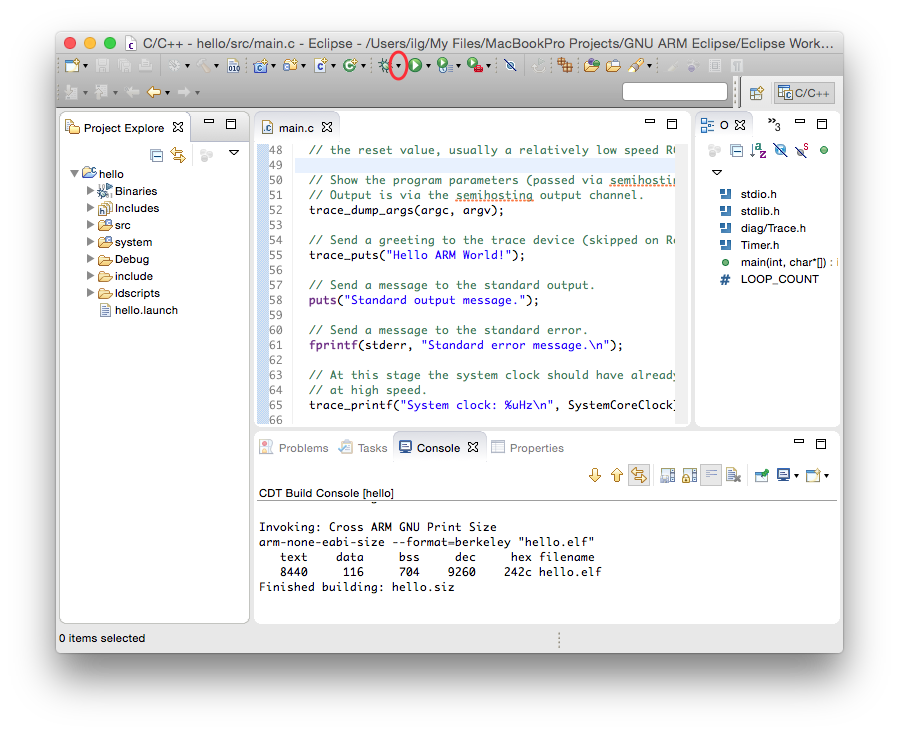
If everything is ok, after a few seconds required to start QEMU, you should see something like this:
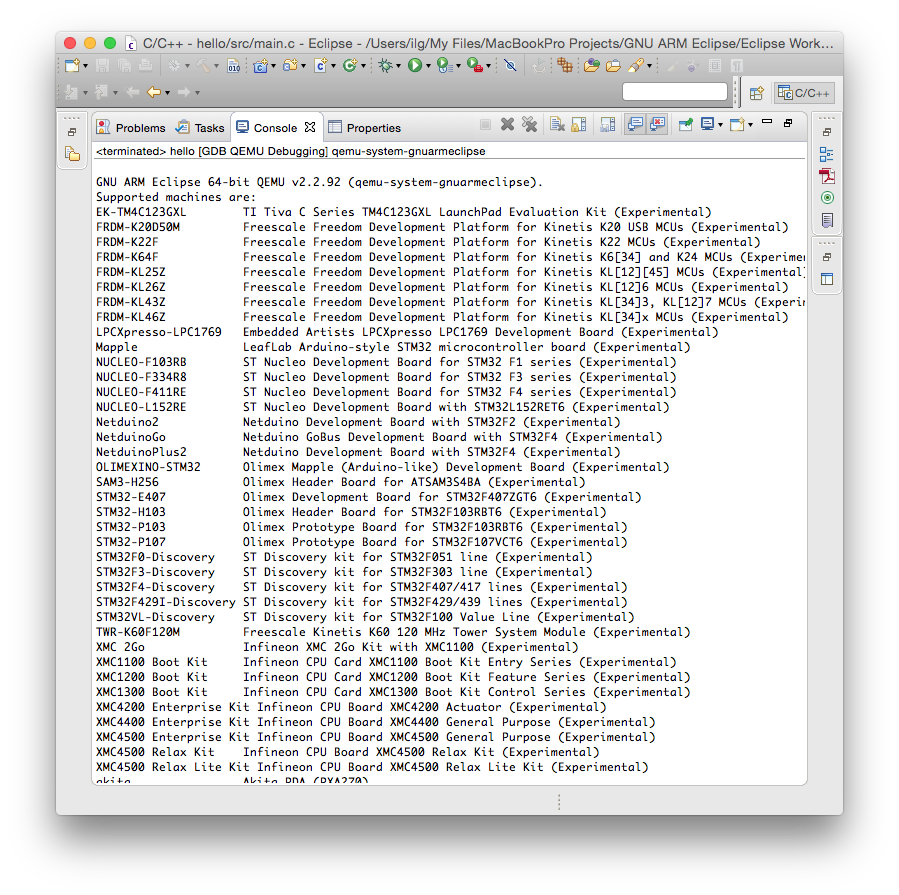
This happened because by default the Board name: field contains a question mark.
Further configure the debug configuration
- in the Eclipse menu, go to Run → Debug Configurations…
- select hello
- select the Debugger tab
- in the Board name: field, enter STM32-H103 (a popular Olimex STM32F103 board)
-
in the Command line: field, after hello, add
3 2 1, as an example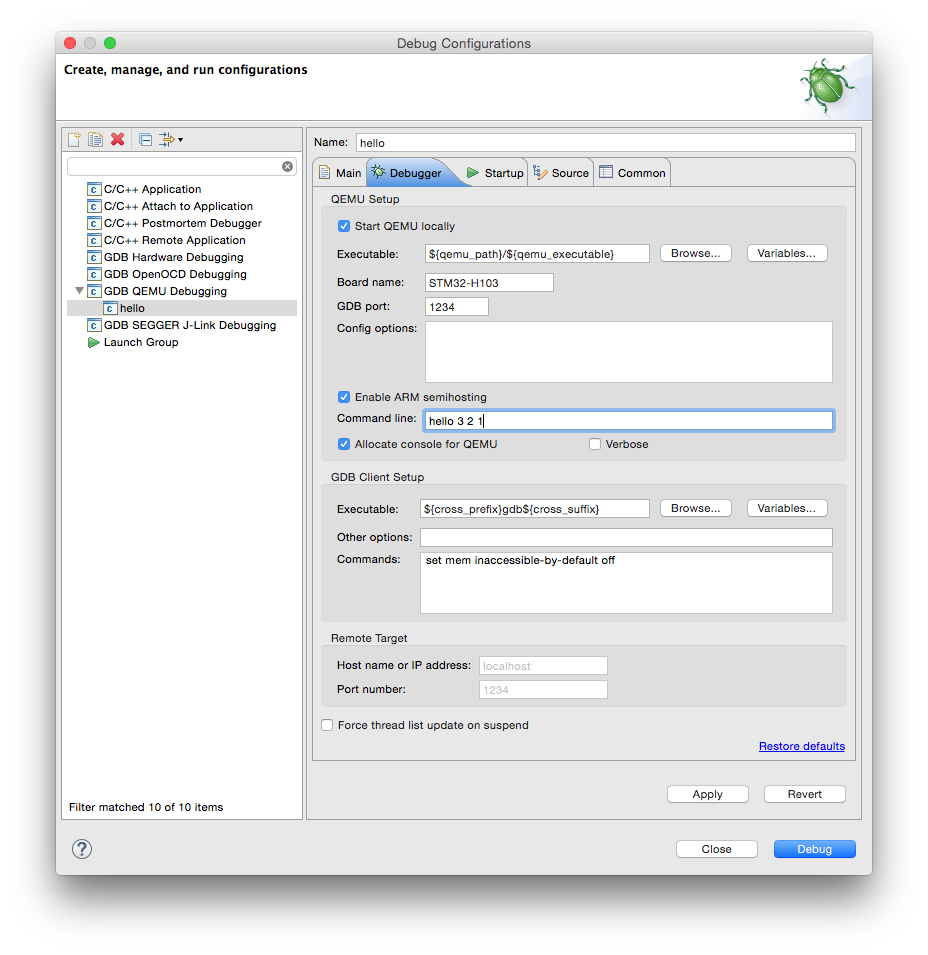
- click the Debug button
If everything is ok, after a few seconds required to start the server, to allow it to connect to the target, start the gdb client, download the application and start the debugging session, you should see something like this:
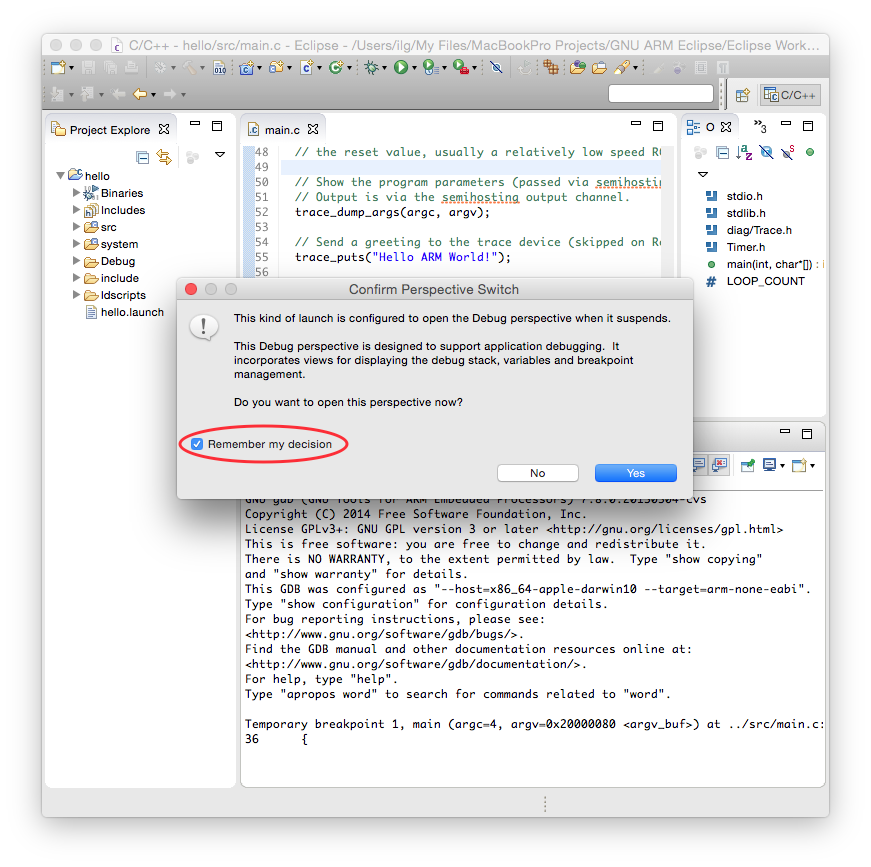
Be sure you enable the Remember my decision check box, otherwise Eclipse will ask this question each and every time you launch this debug configuration. Then click the Yes button.
If everything is ok, after a few seconds required to start QEMUt, start the gdb client, download the application and start the debugging session, you should see something like this:
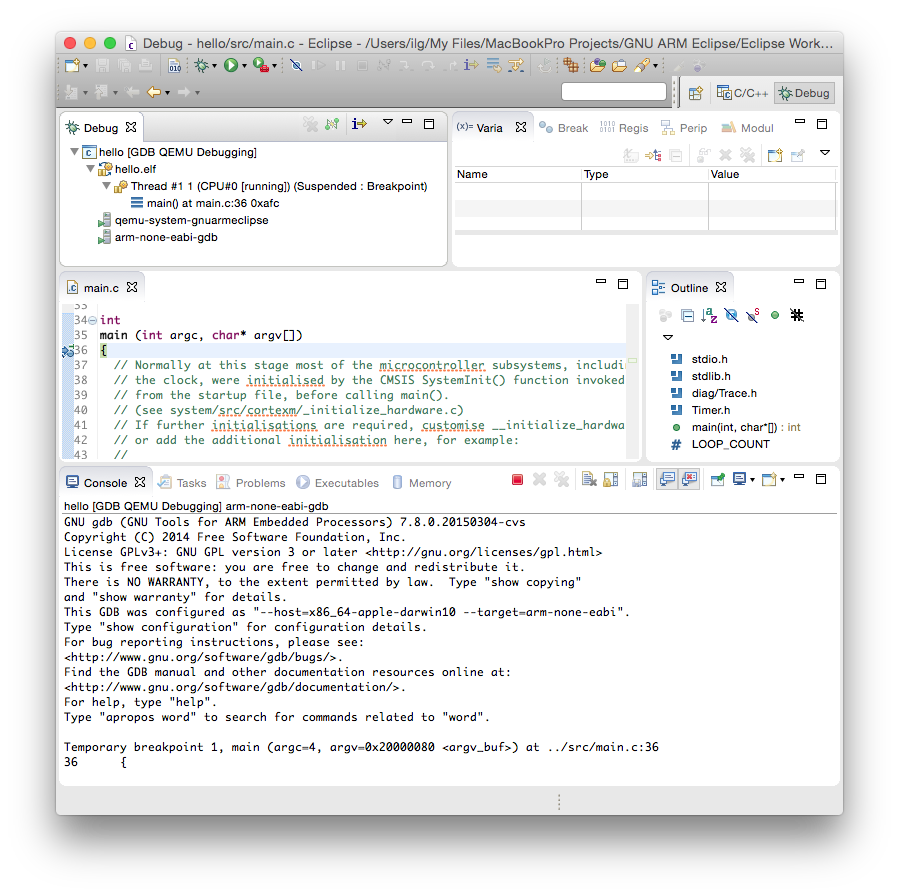
Since the first breakpoint was set in the Debugger tab to main, the execution stopped right at the beginning of the main() function.
Debug operations
Once the debug session started and execution stopped in the first breakpoint (by default set at the beginning of the main() function), you can perform any debug operation you need.
The most common operations are:
- single step over one source instruction (click the Step Over button)
- single step into the next function called (click the Step Into button)
- single step out of the current function (click the Step Return button)
- set breakpoints (click the grey side area at the left of the source lines)
- run (click the Resume button)
- halt a running program (click the Suspend button)
- inspect processor registers (use the Registers view)
- inspect memory (use the Memory view)
For more details please read the Running and debugging projects section in the Eclipse documentation.
View consoles
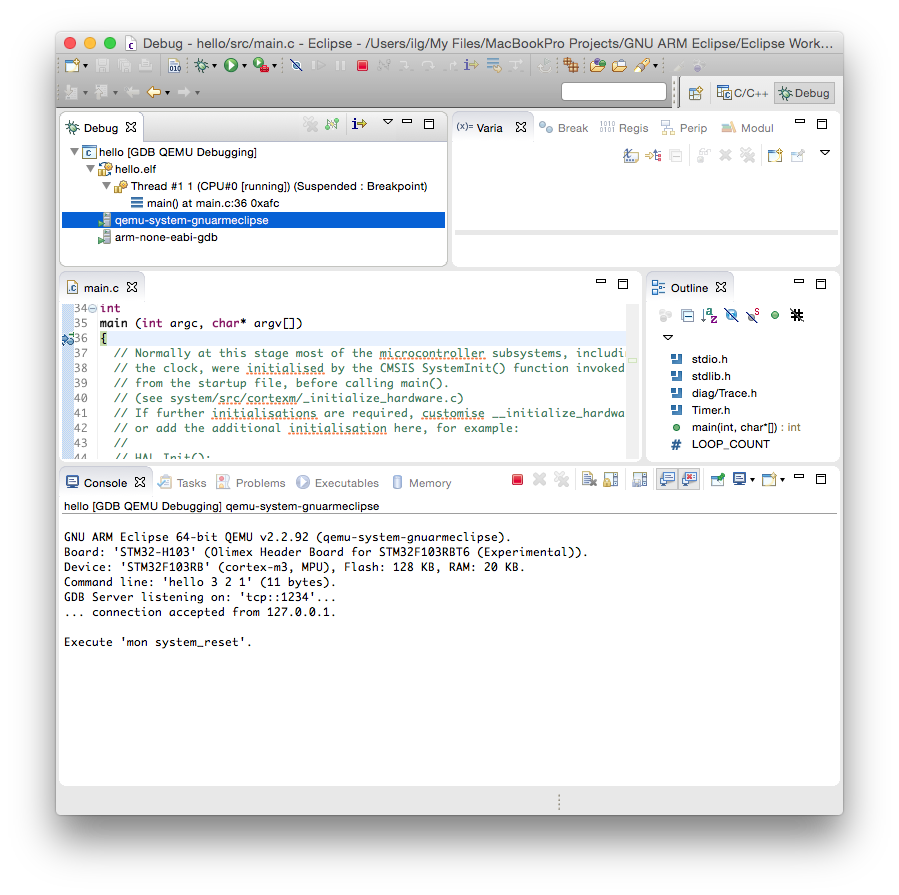
Each debug process has a dedicated console, to display its standard output and standard error, or to get input for the standard input.
To see the console of any process, select the process in the top left window. For example the QEMU console will initially look like this:
select again the main thread in the debugged application (in the upper left window) and click several times the Step Over button, until you reach the timer_start() function.
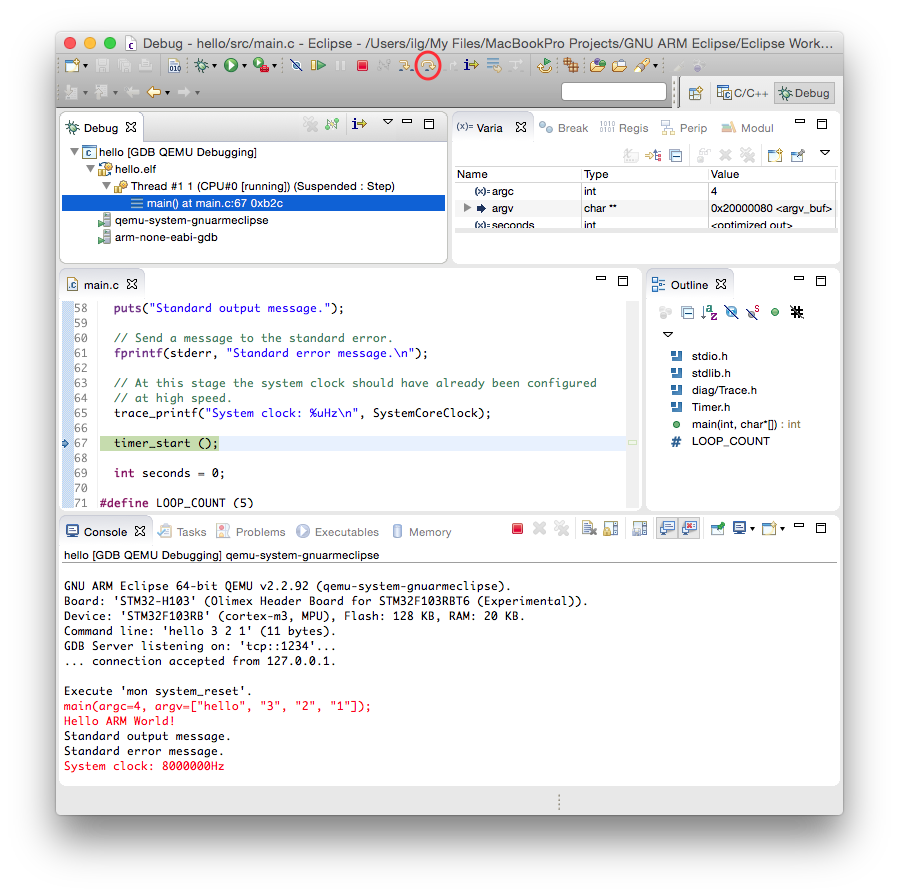
The QEMU console should display the program arguments, passed via semihosting, then exercise various output functions.
Click the Resume button and execution will resume. Watch the console. After three iterations, execution will complete and QEMU will quit with exit code 0 (success).
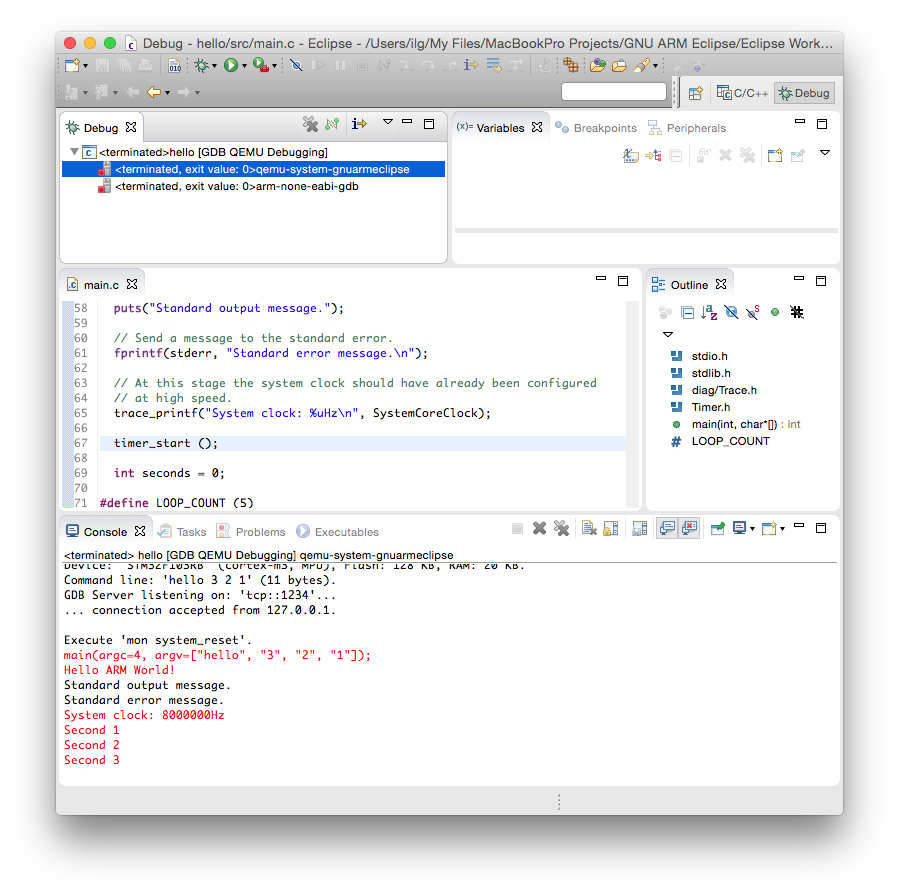
You can experiment with the first argument, which controls the number of iterations in the main loop; edit it to 7 and rerun the application.
No GDB initialisation files loaded
For having a total control of the debugging session, the debugging plug-ins start the GDB client process with the --nx option, which prevents the execution of the commands found in any initialization file; none of the standard files (system.gdbinit, ~/.gdbinit, ./.gdbinit) are loaded.
To add more commands to the GDB initialisation sequence, use the Commands: field in the GDB Client Setup section.
All commands listed here are passed to the GDB client. By convention, commands prefixed with mon will be further passed from the GDB client to the GDB server, in this case the QEMU server.
